Using Visualizations to Improve K-12 Student Learning
Posted on by Bryan Matlen

Written by Bryan Matlen, Benjamin Jee, Nina Simms, and Dedre Gentner
Visuals communicate complex ideas in an effective way. Given our minds are hardwired to extract patterns and relationships from visual material, some students’ learning could be enhanced by educational visuals that reflect the way they think.
In this Insights post, we explain why visuals are useful learning tools and suggest ways in which educators can leverage visuals to support classroom learning. We offer two suggestions about visual comparison, a powerful process that supports enhanced learning that works.
Visualizations are Powerful and Everywhere
We live in a society replete with visualizations. Maps on our smart phones communicate our spatial location, diagrams in print and digital textbooks illustrate scientific processes, and graphs and charts in the news media show us the latest news trends and recent poll numbers. In our visually rich society, comprehending visual representations is an essential skill.
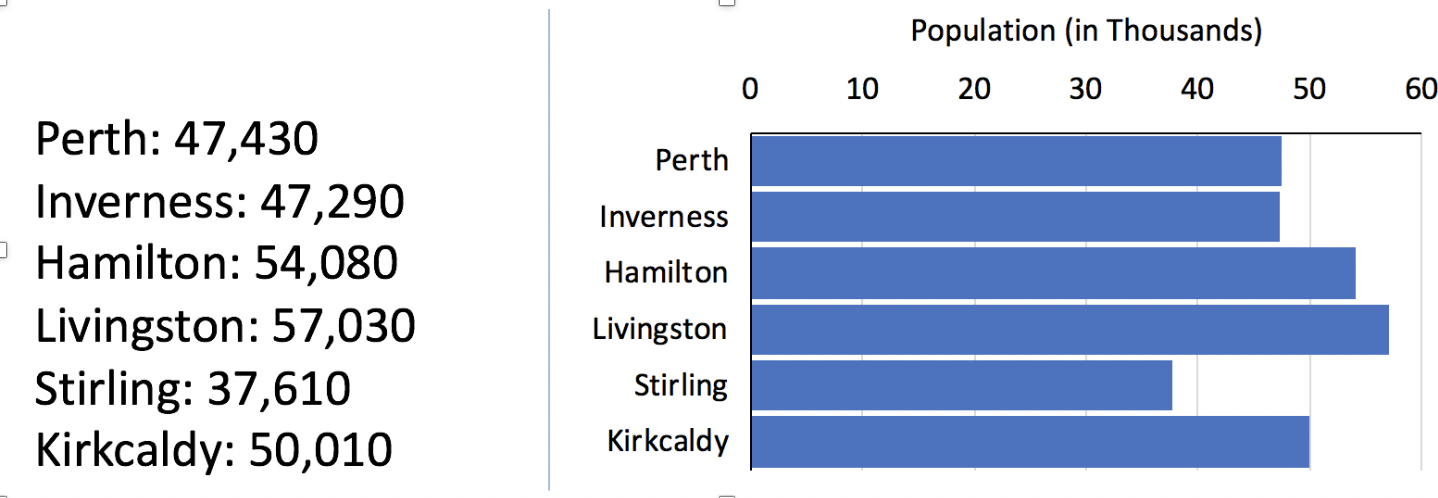
Visualizations are common because they are a powerful and efficient way to communicate complex relationships. As an illustration, Figure 1 below shows two ways of displaying city population data: listed numerically (left) and in a graph (right). In which format is it easier to spot the city with the smallest population? How about the largest?

Figure 1. Two ways of displaying city population data.
Most likely you chose the graph, which allows our visual system to effortlessly spot the relative population sizes. The ease and rapidity with which our brains process visual information paves the way for us to perform further reasoning, such as estimating the average population size. This is because the data are presented spatially, and our visual system is evolutionarily equipped to efficiently process spatial information.
Examples of How Visuals Help
Educators often use visualizations to explain complex spatial concepts. Take chemical bonding or geologic plate movement — grasping these concepts require students to represent how objects relate to each other in space. Even though humans are sophisticated visual processors, new and spatially complex visuals often require additional supports for students to understand them.
Our research has identified two ways that educators can improve students’ learning from visuals.
Multiple Visualizations of the Same or Related Concepts
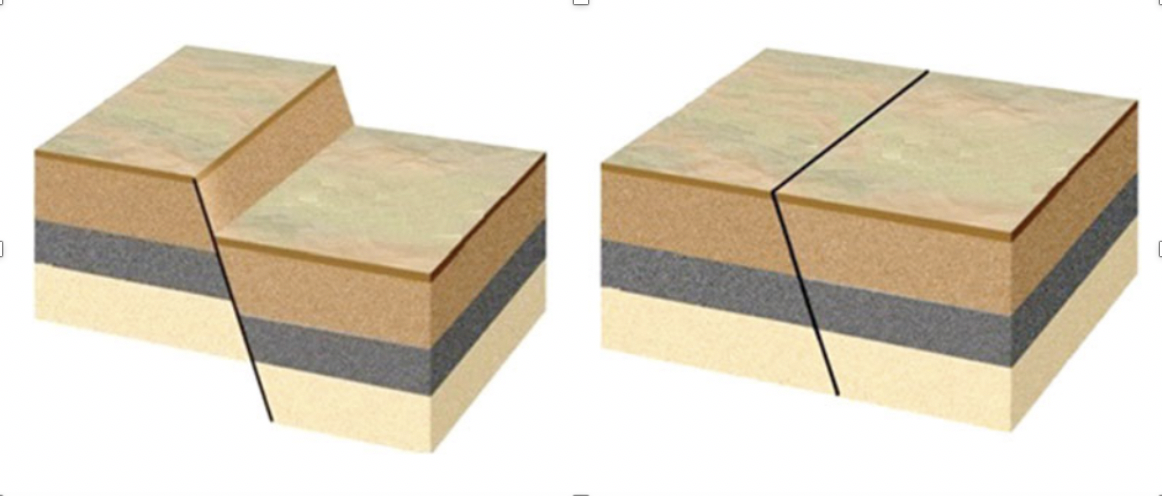
Students often learn more when they are instructed to compare multiple visualizations of the same or related concepts. Comparison directs attention to the essential spatial relationships and allows viewers to identify conceptually important similarities and differences (see Figure 2). In this way, students can more efficiently grasp the key information and also figure out what is irrelevant.

Figure 2. A geological fault (left) and a geological fracture with no fault (right). Students can better understand each spatial concept when they compare the two visuals.
Direct, Uninterrupted Paths Make Learning More Effective
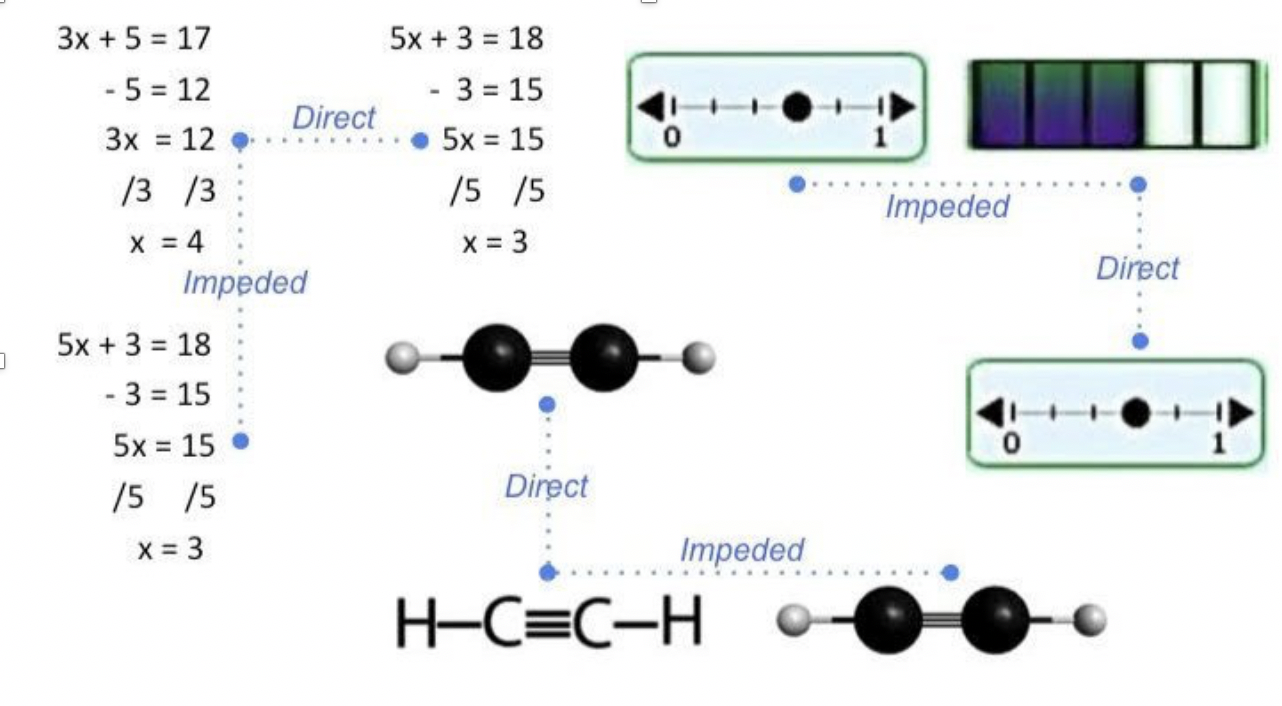
Our research suggests the way in which visuals are placed on a page or screen affects how effectively we compare them. Specifically, comparison is most effective when visuals are placed so that their matching parts have a direct, uninterrupted path between them. This direct placement allows students to see the important relationships. In contrast, impeded placements are those in which the matching parts are obstructed by other, non-matching parts, distracting from the comparison (see Figure 3). This type of placement makes comparison more difficult.

Figure 3. Direct (most effective for learning) and impeded comparisons in STEM. For example, in the comparison of molecules, each visual has atoms displayed from left-to-right (H-C-C-H). Therefore, the optimal placement is from top-to-bottom, as the corresponding atoms have a direct and clear path to one another. In the left-to-right (impeded) placement, two carbon atoms and a non-analogous hydrogen atom intervene between corresponding hydrogen atoms, making the comparison more difficult.
Opportunities to Improve Educational Visuals
Because textbooks offer a critical format for learning from visualizations, in our research we asked, how are students commonly exposed to visual comparisons in educational settings? To explore this question, we coded science textbook visuals for the presence of direct vs. impeded spatial placement, sampling chapters from the three most popular middle school texts in the United States.
We identified 313 visuals in total, almost 2 per page. Each visual was then coded for a) the presence of comparison, using text-based cues and symbols (e.g., causal arrows), as well as b) the spatial placement of the objects in the image.
Results indicated that while comparison was relatively common (37% of the visuals), fewer than half of the comparisons involved direct (most effective) spatial placement. Thus, substantial opportunities exist to improve the design of visuals in STEM textbooks.
Our research team will continue to test the effects of visual comparison in STEM domains, the results of which will have broad implications for design, instruction, and theories of human cognition and learning. Visit the IES website to learn more about this project.
About the Researchers
Bryan Matlen is a Senior Research Associate at WestEd. He studies the application of learning theory to educational contexts, visual representations, and analogical learning.
Benjamin Jee is an Associate Professor of Psychology at Worcester State University. He studies cognition and learning in science.
Nina Simms is a Postdoctoral Fellow in the Spatial Intelligence and Learning Center (SILC) at Northwestern University. Her research explores analogical reasoning, spatial cognition, and conceptual development.
Dedre Gentner is a Professor at Northwestern University. She is well known for her research on analogical learning and reasoning, similarity and metaphor, and conceptual development.
