Data Fluency in Middle School Science: Equipping the STEM Leaders of Tomorrow
Posted on
This post was originally published by WestEd’s Making Sense of SCIENCE.
By Nicole Wong, Corynn Del Core, Arlene Nicolas, and Leticia Perez
Whether we realize it or not, data are all around us. It’s fundamental to making sense of our world from understanding patterns and trends to utilizing artificial intelligence for increased efficiency. People use data every day to make decisions like deciding what to wear based on the weather forecast, selecting a movie to watch from personalized recommendations, or selecting where to eat based on a restaurant’s stars or reviews.
For today’s students—and the future of our workforce—it is increasingly important to become fluent in gathering and analyzing data. The U.S. Bureau of Labor Statistics projects that over the next decade, data-focused occupations are expected to grow faster than the average rate of growth for all occupations. Equipping students with tools and knowledge for making sense of data is important for helping students eventually leverage those skills and interests into a well-paying career.
Arlene Nicolas, a veteran science teacher of 28 years, is deeply committed to preparing her students for 21st-century careers grounded in data science. When she recognized that her students were highly interested in technology and adept at using it, she wanted to find a way to better support their needs and abilities while nourishing their excitement for engaging with data through technology.
Ms. Nicolas decided to join the Data Fluency: Making Sense of Data in STEM professional learning course for the 2023–24 school year. The course, led by Making Sense of SCIENCE at WestEd, is designed to help math and science teachers improve their own data knowledge and learn how to support their students’ data fluency by giving them access to datasets, technological tools, and strategies for integrating data into their instruction.
Data fluency is the ability and confidence to actively make sense of and use data. It extends beyond possessing discrete knowledge and skills to knowing when, how, and why to use data to explore topics of interest and for a specific purpose. Learners develop this fluency by exploring data, getting data, asking questions or designing solutions, interpreting data, and communicating about data.
Preparing Teachers for Data-Rich Instruction
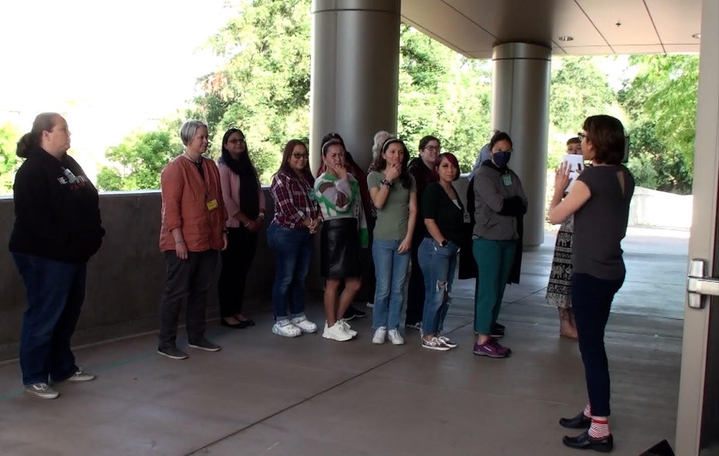
During a 3-day summer institute, Ms. Nicolas and fellow math and science teachers collaboratively engaged in their own adult-level learning by collecting, exploring, and making sense of data. Then they honed their skills for preparing and facilitating data instruction by analyzing cases of classroom practice and by planning what they might do in their own classrooms.
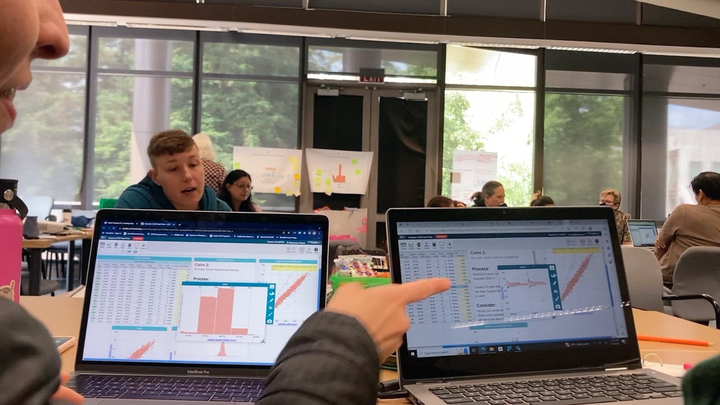
In one activity, Ms. Nicolas explored historical data about extreme heat events where the temperature reached 100°F or higher in two cities: Tucson, Arizona, and Stockton, California. Ms. Nicolas and her activity partner, another science teacher, chatted excitedly as they used an online data visualization tool called CODAP to generate many different graphs and make sense of each one. It was immediately clear to Ms. Nicolas how fun and accessible the tool was — and how much value it could bring to her students. She remembered manually charting data during graduate school, and she knew that CODAP could help her students quickly create representations to help them ask and answer questions that would be meaningful to them through data exploration.
After the summer institute Ms. Nicolas moved to the Philippines, but she was able to stay connected with her Data Fluency cohort by participating in a series of community-of-practice meetings. Via online sessions, Ms. Nicolas and the other teachers worked together to plan, teach, and reflect on data lessons for their students.
Engaging Students with Technological Tools for Making Sense of Data
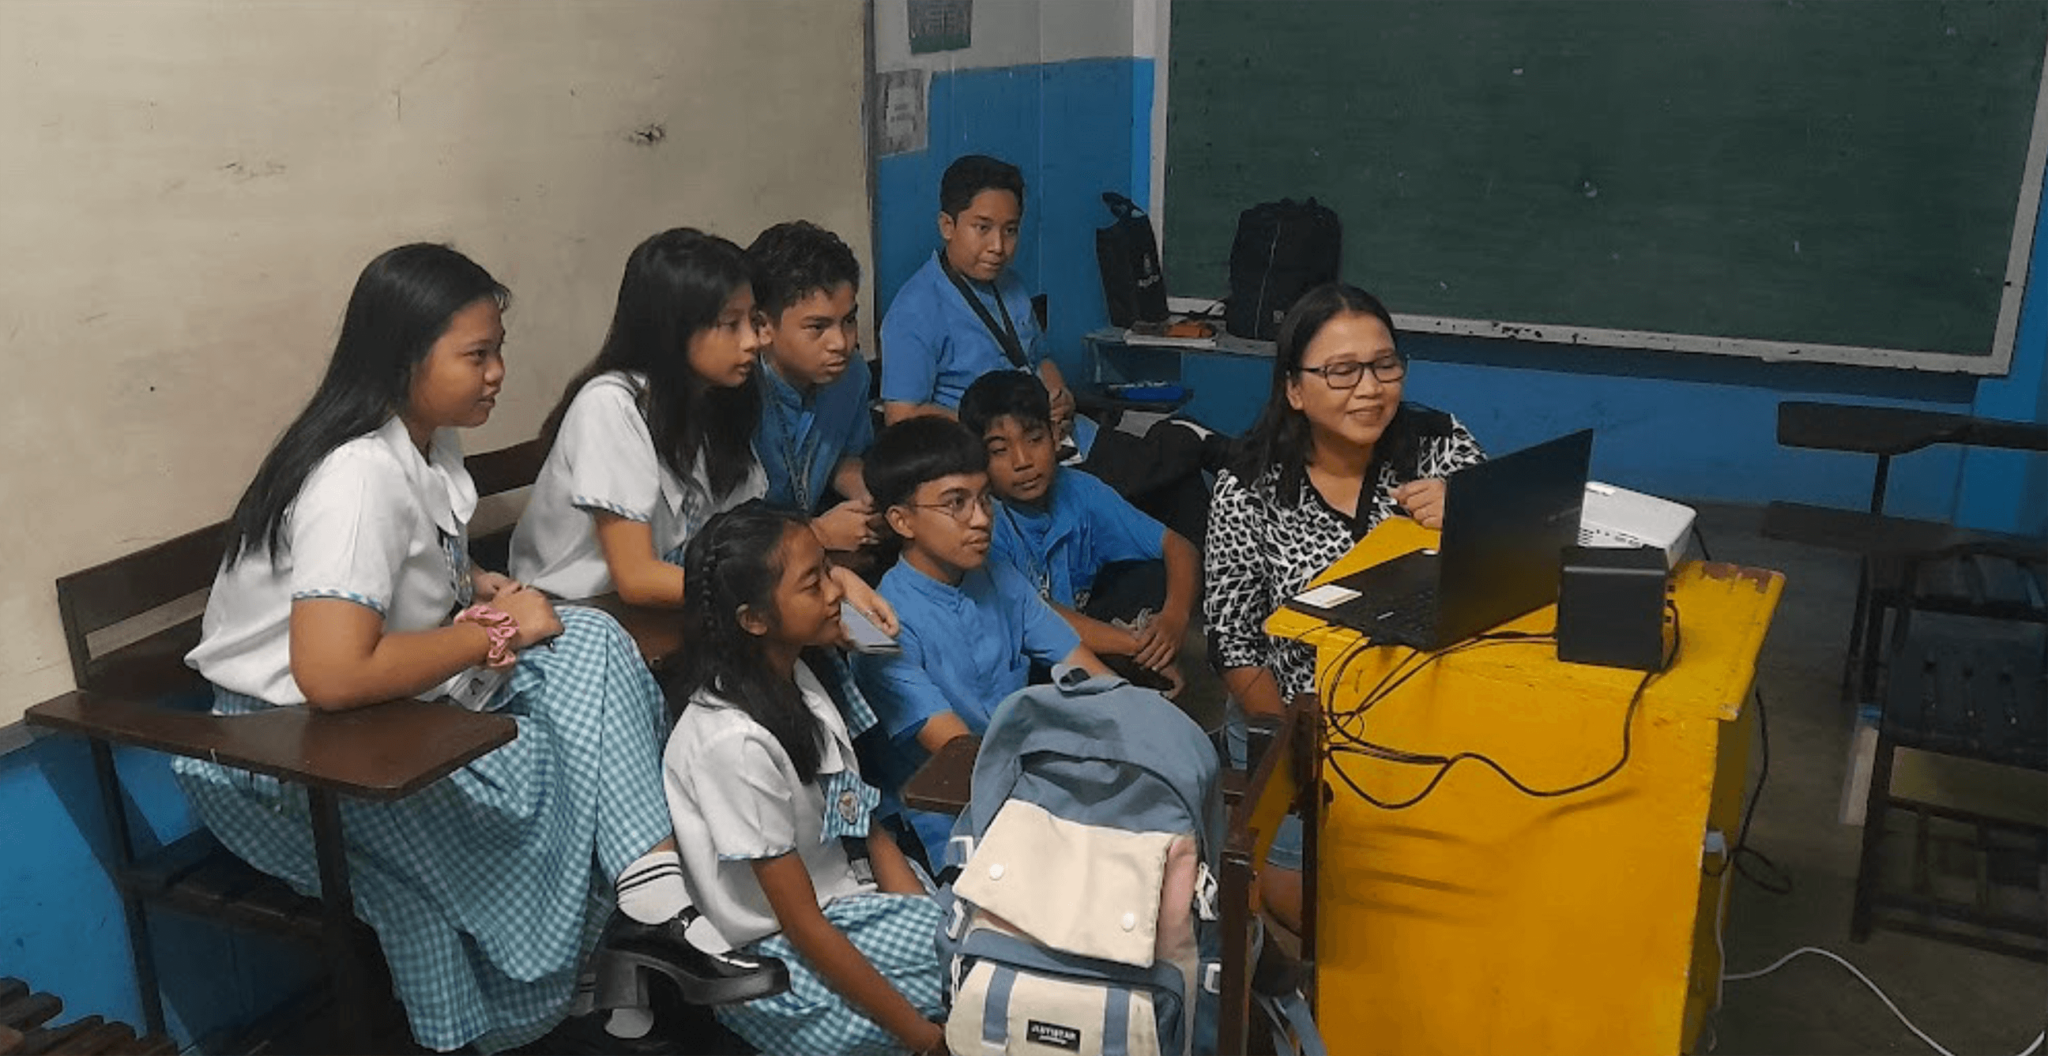
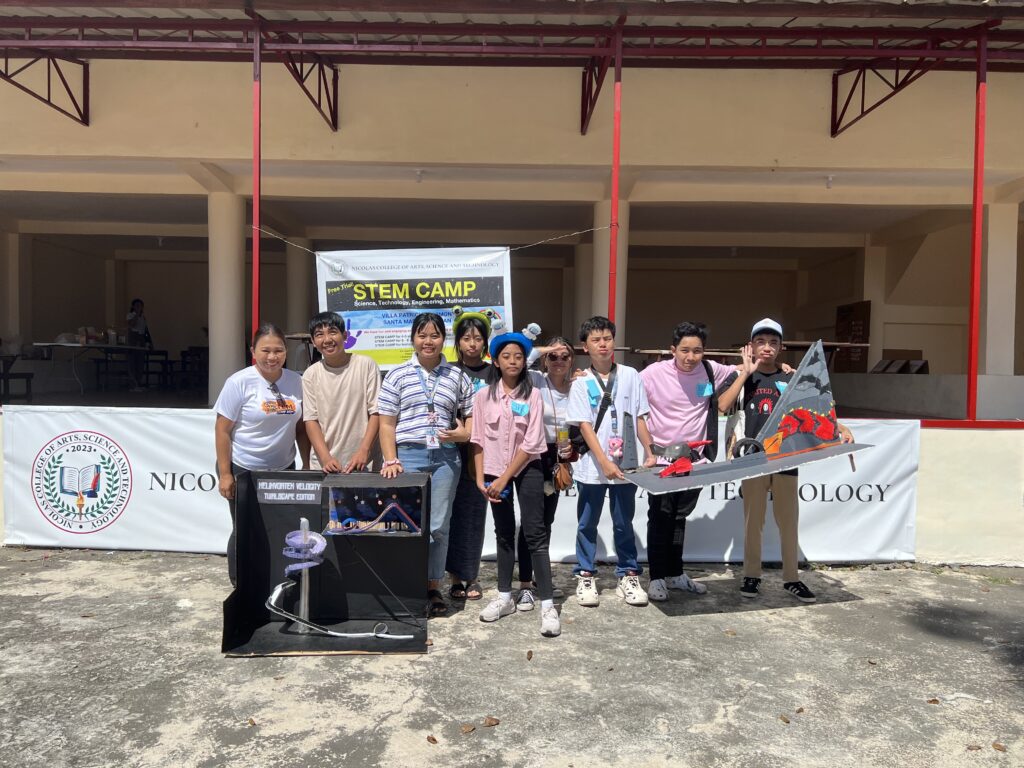
Ms. Nicolas found an opportunity to introduce data learning into an engineering project with her 10th grade students at her new school in the Philippines. Her students were excited about the project: first, analyzing data to learn about factors related to roller coaster construction, then engaging in the engineering portion of the project where they would design and build their own roller coasters.
Ms. Nicolas was determined to share CODAP with her students even though her classroom was not equipped with computers. She wanted her students to use technology to interact with datasets rather than interpreting ready-made plots that she created and printed for them: she wanted to put her students in the driver’s seat. To bring CODAP and data science to her classroom, Ms. Nicolas brought in two laptops and used her phone as a hotspot to connect them to the internet. Students used a dataset that had a large number of variables from 157 individual roller coasters in the United States, such as maximum height, maximum speed, date of construction, roller coaster type, location, and number of inversions. The large dataset allowed students to investigate a wide range of questions.
“We are very thankful for CODAP. For example, in our roller coaster project, we used data to see how the duration, speed, and length of roller coasters affect each other.”
—Denise Yu, 10th grade student
Ms. Nicolas was surprised at how quickly her students moved beyond the guiding questions in the lesson and started asking their own questions and exploring possible answers using data. She said, “I was so impressed with the kids. They didn’t just focus on the guide question that I gave them, but they explored more by using CODAP and checking the attributes given in CODAP.”
Her students were so engaged by the data activity that many of them continued to use CODAP at home. Their excitement led to ideas about future uses of CODAP, too. When given the opportunity to speak with CODAP’s developer, they requested more datasets and asked whether the CODAP team had any plans to integrate artificial intelligence into the system. Others in Ms. Nicolas’s school also took notice of her students’ excitement about the project. The school principal shared that working with the data in CODAP “opened the eyes” of the students who were “eagerly participating with enthusiasm and joy.”
Equipping the STEM Leaders of Tomorrow
When we are going to senior high school [11th and 12th grade] and college, I think [CODAP and work with data] will be a good advantage to us students because we can input that into our research.
—Jamina Kayla Mapesos, 10th grade student
By providing her students with opportunities to explore data with tools like CODAP, Ms. Nicolas hopes to give her students a greater sense of ownership over their learning. “CODAP is a tool that will zap the gap between engagement and learning of Generation Z students. By using data and tools like CODAP, we can improve the quality of the teaching and learning process, and develop ownership of students’ own learning, while exploring data around the world.”
She also believes that fostering data fluency will prepare her students for future careers in STEM. “I believe that this will help us to create or develop students who will be data analysts in the future. It’s not only the knowledge—math knowledge or science knowledge—that they will gain, but also, they can use the tools needed for this generation.”
Inspired by her students’ skill, interest, and engagement with data, Ms. Nicolas intends to share the tools and strategies from the Data Fluency professional learning course with other teachers in her school.
Some of the educator resources from the Data Fluency: Making Sense of Data in STEM professional learning include:
- Principles of Data-Rich Instruction
- Entryways to Data
- Data Sentence Starter Classroom Posters
- Data Biographies
Boosting Data Science Teaching and Learning in STEM is a collaboration between WestEd’s Making Sense of SCIENCE team and The Concord Consortium, and is funded by the National Science Foundation.
Are you interested in learning more about our Making Sense of SCIENCE professional learning courses? Visit https://mss.wested.org/
Want to get in touch with the Data Fluency team? Contact: [email protected]
Arlene Nicolas is a science teacher at Immaculate Heart of Mary Integrated School in The Philippines. Nicole Wong is a Senior Research Associate, Corynn Del Core is the Lead Digital and Print Media Artist, and Leticia Perez is the Senior Professional Learning Specialist in Data Science for the Making Sense of SCIENCE project at WestEd.